Cost Data · Updated September 27, 2026

Data Center Cost per MW by State: 2026 Build Costs, Power Rates and Grid Queues

What does a data center cost per megawatt, and how much does the state change the answer? This page puts the SCR AI Build Configurator's cost data for all 50 states and DC in one table: facility cost per MW, the indicative large-load power rate, how long the grid queue runs, the construction cost factor and whether equipment sales-tax exemptions are open. Every figure is the same data licensees run in the configurator.


Data Center Cost per MW by State: Build cost, power rate and grid queue for all 50 states

Data Center Cost per MW by Build Type

Cost per megawatt depends first on what you are building. Using the configurator's Q3 2026 constants, facility cost per MW of IT load (shell, fit-out, land, utility works and network, before accelerators, taxes and power) is:

Build typeC$ per MWApprox. US$ per MWBuild time
Hyperscale AI factory (100 MW-1 GW+)29.85M21.2M38 months
Edge / micro deployment28.38M20.1M8 months
Neocloud / GPU-as-a-service16.67M11.8M20 months
Modular / prefabricated15.92M11.3M11 months
Powered shell (lease the megawatt)12.40M8.8M30 months
Bitcoin miner retrofit10.55M7.5M20 months
Hybrid mining + AI8.75M6.2M16 months

For AI builds that buy their own accelerators, GPUs usually cost far more than the building, so the full project cost per MW can be several times these facility numbers.
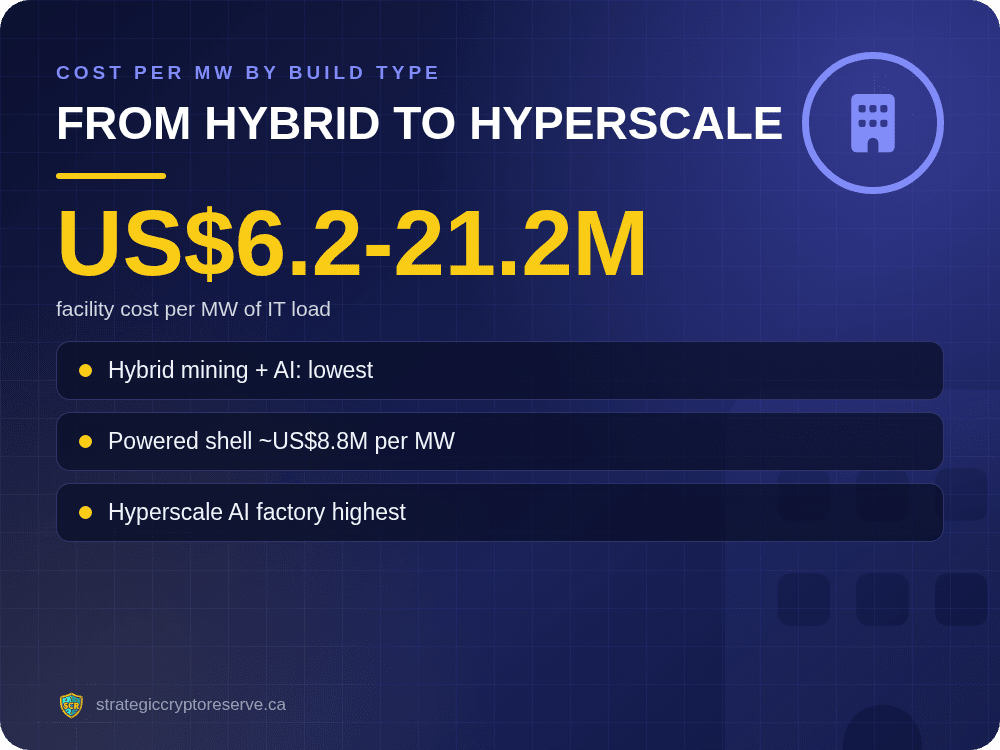
From hybrid to hyperscale: facility cost per MW of IT load Facility cost, not GPUs: line items: shell, fit-out, land, utility, network

Cost per MW, Power Rate and Grid Queue in All 50 States

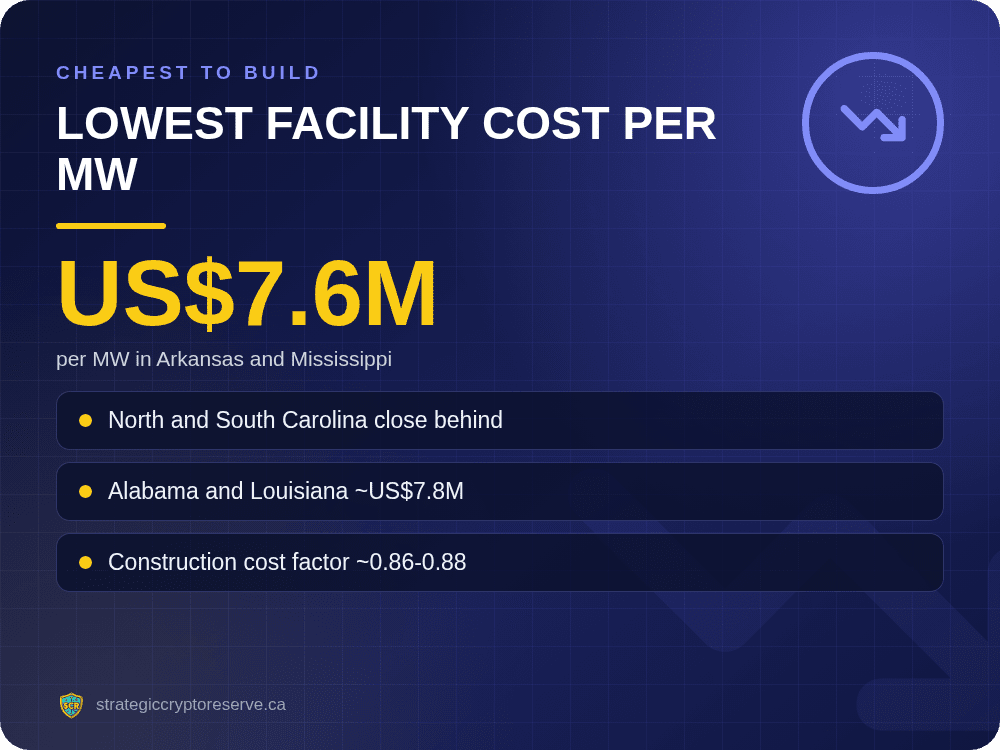
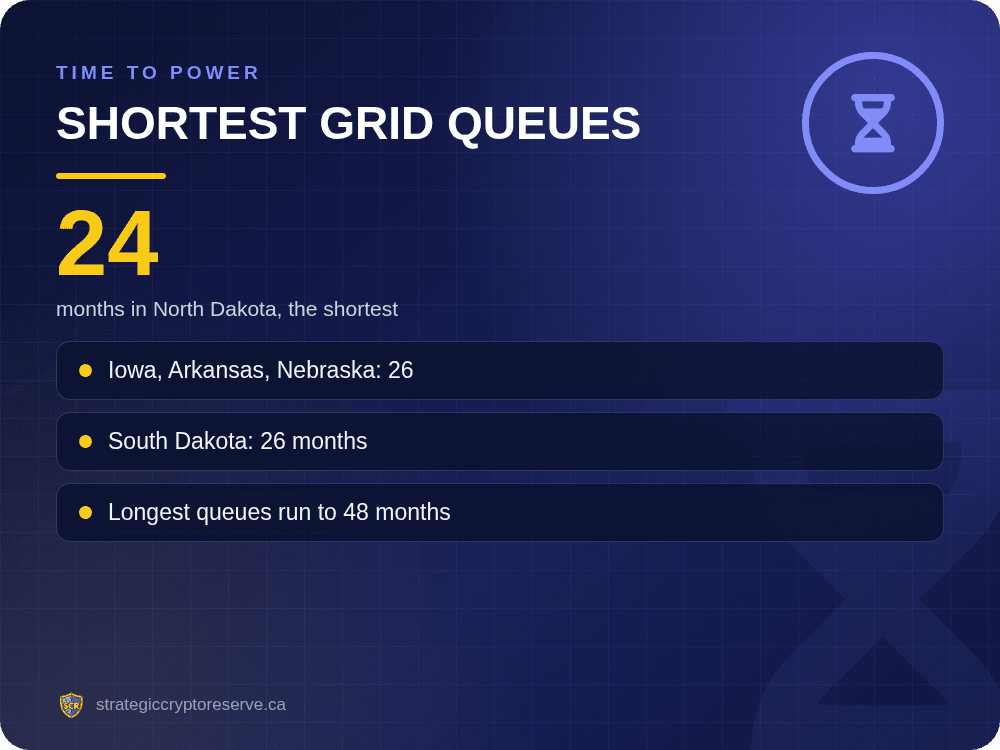
Lowest facility cost per MW: per MW in Arkansas and Mississippi Shortest grid queues: months in North Dakota, the shortest

The table below applies each state's construction cost factor to the powered-shell profile, the most common reference build, and adds the indicative large-load power rate, grid queue and equipment sales-tax exemption status. State names link to our large-load tariff breakdown for that state.

Lowest facility cost per MW: Arkansas (US$7.6M), Mississippi (US$7.6M), North Carolina (US$7.7M), South Carolina (US$7.7M), Alabama (US$7.8M), Louisiana (US$7.8M).

Lowest indicative power rates: Louisiana (6.5¢), New Mexico (6.5¢), Oklahoma (6.8¢), Texas (7.1¢), South Carolina (7.3¢), Tennessee (7.4¢).

Shortest grid queues: North Dakota (24 months), Iowa (26 months), Arkansas (26 months), Nebraska (26 months), South Dakota (26 months), Oklahoma (28 months).

No state wins on every measure. The cheapest places to build are not always the cheapest to power, and the fastest queues are mostly in smaller Plains markets. The full table follows.

Indicative figures from the SCR AI Build Configurator (v1.3.2, Q3 2026 data). Powered-shell facility cost per MW of IT load, before GPUs, taxes and power. Rates are indicative large-load industrial averages (EIA-based), not tariffs.
StatePower rate (US/kWh)Grid queue (months)Build cost factorFacility cost per MWEquipment tax exemption
Alabama7.6¢300.88US$7.8MOpen
Alaska20.5¢361.25US$10.9MNone
Arizona8.8¢420.92US$8.1MPaused
Arkansas7.6¢260.86US$7.6MOpen
California20.5¢481.22US$10.6MNone
Colorado9.2¢320.98US$8.6MNone
Connecticut16.0¢301.12US$9.8MOpen
Delaware9.8¢321.03US$9.0MNo sales tax
District of Columbia12.0¢361.05US$9.2MNone
Florida10.1¢300.90US$8.0MOpen
Georgia8.0¢360.90US$8.0MOpen
Hawaii38.0¢481.30US$11.3MNone
Idaho8.2¢300.90US$8.0MOpen
Illinois9.8¢361.15US$10.0MPaused
Indiana9.2¢300.95US$8.4MOpen
Iowa7.5¢260.93US$8.2MOpen
Kansas8.3¢280.90US$8.0MOpen
Kentucky7.6¢280.92US$8.1MOpen
Louisiana6.5¢300.88US$7.8MOpen
Maine13.0¢300.93US$8.2MOpen
Maryland10.8¢360.98US$8.6MOpen
Massachusetts18.5¢361.15US$10.0MPaused
Michigan8.9¢320.98US$8.6MOpen
Minnesota9.8¢321.05US$9.2MOpen
Mississippi8.0¢280.86US$7.6MOpen
Missouri8.3¢280.98US$8.6MOpen
Montana8.4¢300.92US$8.1MNo sales tax
Nebraska8.4¢260.90US$8.0MPaused
Nevada11.0¢361.02US$9.0MOpen
New Hampshire16.5¢300.97US$8.5MNo sales tax
New Jersey13.5¢361.18US$10.3MPaused
New Mexico6.5¢300.90US$8.0MNone
New York7.8¢421.22US$10.6MNone
North Carolina7.8¢320.87US$7.7MOpen
North Dakota7.9¢240.92US$8.1MOpen
Ohio8.3¢420.96US$8.5MPaused
Oklahoma6.8¢280.88US$7.8MPaused
Oregon8.2¢421.05US$9.2MNo sales tax
Pennsylvania8.8¢361.04US$9.1MOpen
Rhode Island19.5¢301.08US$9.5MNone
South Carolina7.3¢300.87US$7.7MOpen
South Dakota8.6¢260.88US$7.8MNone
Tennessee7.4¢320.88US$7.8MOpen
Texas7.1¢300.90US$8.0MOpen
Utah7.6¢320.92US$8.1MOpen
Vermont12.2¢300.94US$8.3MNone
Virginia9.5¢480.95US$8.4MOpen
Washington7.5¢361.06US$9.3MOpen
West Virginia8.1¢300.95US$8.4MOpen
Wisconsin9.4¢321.00US$8.8MOpen
Wyoming7.7¢280.90US$8.0MOpen

What Moves the Cost per MW Most

Three things swing a data center's economics more than the building itself:

Power price
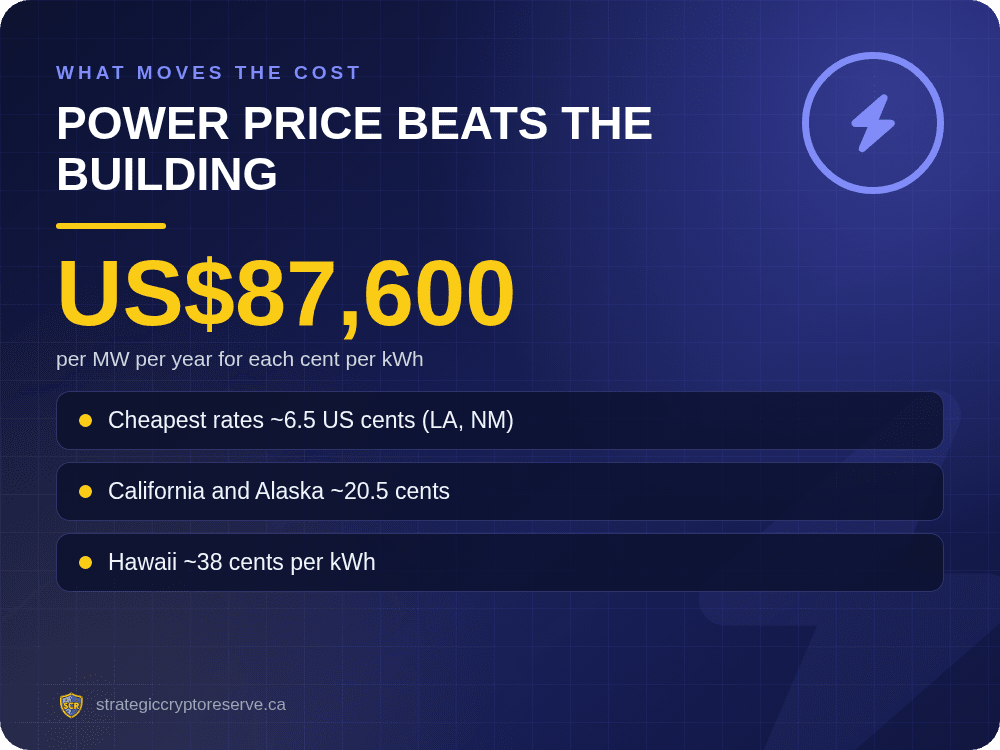
At near-continuous load, every cent per kWh is worth about US$87,600 per MW per year. The gap between the cheapest states and California or Hawaii is several million dollars per MW over a decade.
Time to power
Grid queues of 24 to 48 months often matter more than construction speed. A site energised a year earlier starts earning a year earlier.
Large-load tariffs
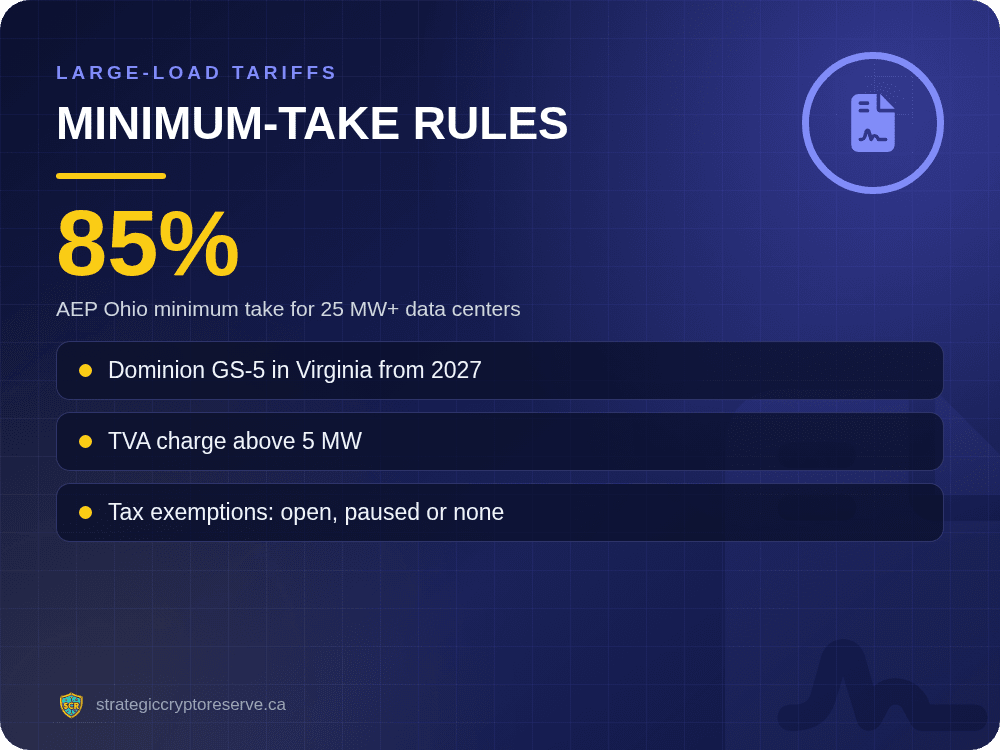
More utilities now charge minimum-take or take-or-pay rates for large loads (AEP Ohio at 25 MW and 85%, Dominion GS-5 in Virginia, TVA above 5 MW). Those rules change the real cost of power, especially for flexible loads. See the tariff library.
Tax treatment
Equipment sales-tax exemptions are open in some states, paused in others and absent in the rest, which can move equipment cost by 5-10%.
Power price beats the building: per MW per year for each cent per kWh Minimum-take rules: AEP Ohio minimum take for 25 MW+ data centers

Run the Numbers for a Specific Site

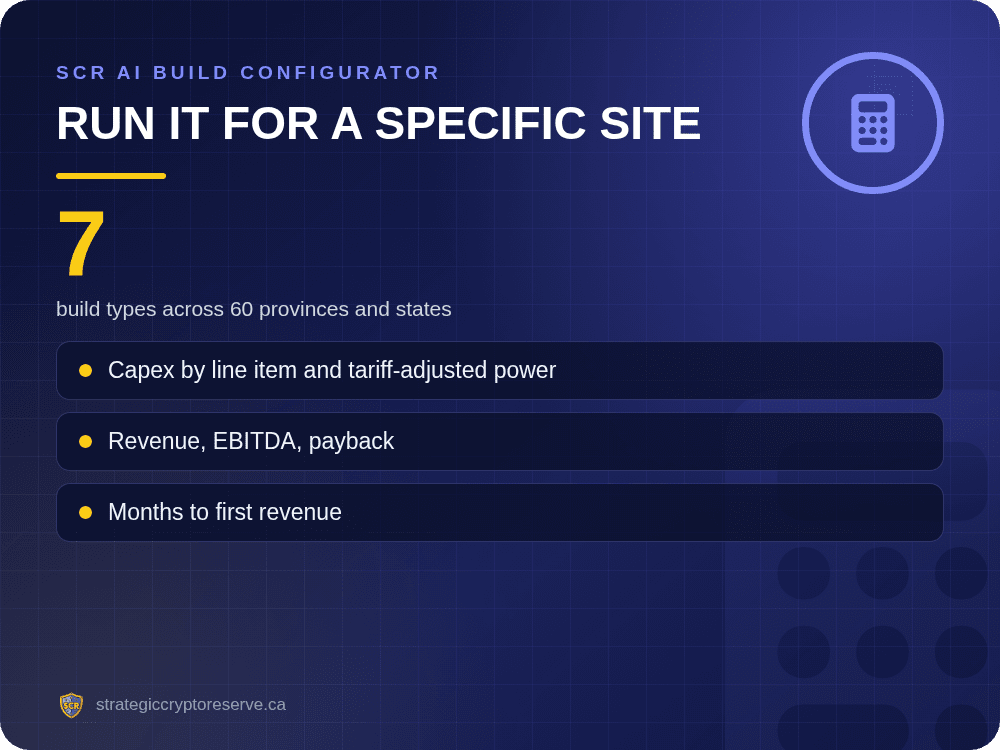
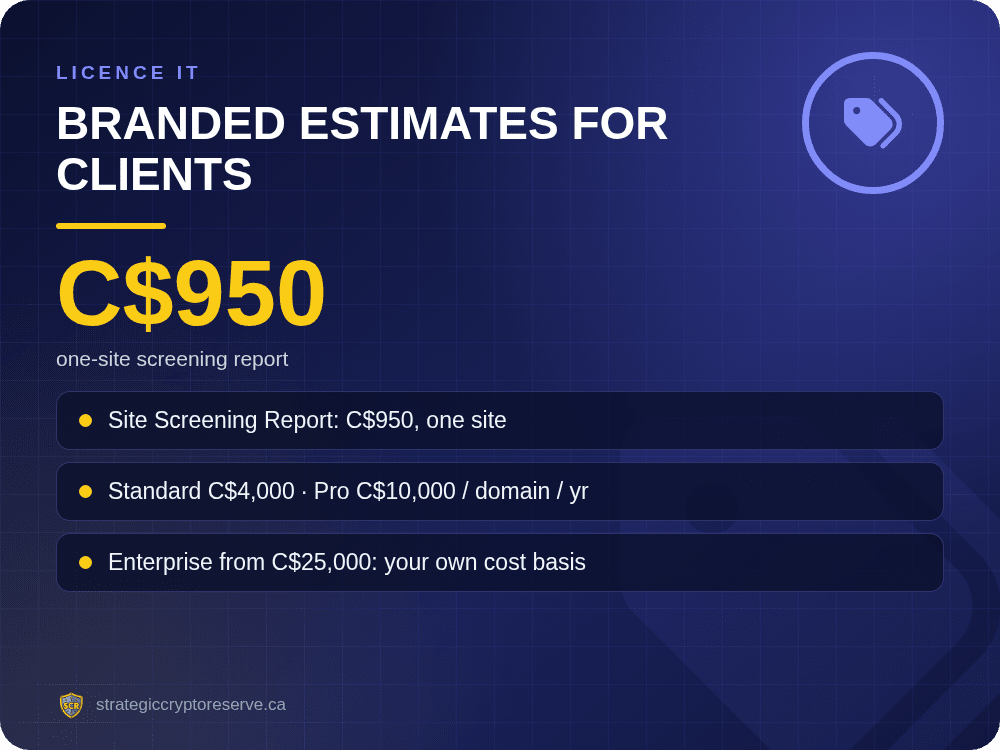
Run it for a specific site: build types across 60 provinces and states Branded estimates for clients: one-site screening report

The table gives the headline figures. The SCR AI Build Configurator goes further for any province or state: choose one of seven build types, cooling and accelerator class, and it returns capex by line item, energy cost with the state's large-load tariff applied, revenue by commercial structure, EBITDA, payback and months to first revenue.

Site-selection consultants, colocation developers, power brokers and EPC firms license it to give clients instant, branded budget estimates, and Enterprise licensees run it on their own cost basis. Outputs are planning-grade estimates for screening, not engineered quotes.

OptionPrice (CAD)Best for
Site Screening Report$950, one siteA single build you want priced and screened now, with nothing to embed
Standard licence$4,000 / domain / yearAdvisors who need the three lease-model configurations and a clipboard summary
Pro licence$10,000 / domain / yearConsultants and contractors who send CSV deliverables and want all seven configurations, white-label and lead capture
EnterpriseFrom $25,000 / year, up to 3 domainsDevelopers and EPC firms who want the model running on their own cost basis, attribution removed

Frequently Asked Questions

How much does a data center cost per MW in 2026?

Using the SCR AI Build Configurator's Q3 2026 constants, facility cost ranges from about US$6.2M per MW for a hybrid mining and AI site to about US$21.2M per MW for a hyperscale AI factory, before GPUs, taxes and power. A powered shell sits around US$8.8M per MW at the national cost level.

Which state is cheapest to build a data center in?

On facility cost alone, the lowest construction cost factors in the configurator data put Arkansas, Mississippi and North Carolina at the top. On power price, Louisiana, New Mexico and Oklahoma have the lowest indicative large-load rates. The best site balances both with grid queue and tariff rules.

Does the cost per MW include GPUs?

No. The facility figures cover shell, fit-out, land, utility works and network. For AI builds that buy their own accelerators, GPUs can cost more than the facility itself.

How long does it take to get power for a data center?

The configurator data shows indicative grid queues of roughly 24 to 48 months from signed agreement to energisation, depending on the state and utility.

Where does this data come from?

The same dataset that powers the SCR AI Build Configurator (v1.3.2, data vintage Q3 2026): EIA-based state industrial power rates indexed to April 2026, published build-cost benchmarks and state construction cost factors, and state large-load tariff and tax-exemption status verified through August 2026.